This guide pertains to Ultra Course View.
If your course is in Original Course View, see the Original Course View tutorial collection.
Course Activity Report Overview
Identifying students at risk is challenging. This challenge is compounded when teaching multiple courses and large numbers of students. The Course Activity report helps the instructor understand how well students are performing in their course and how much they are interacting within the course. All roles with the privilege to view grades can access the Course Activity report. Note: The Course Activity page relies on the Overall Grade in the Gradebook to be functional.
From this report, instructors can:
- Identify struggling students based on their overall grade, the number of hours they spend in your course, and the number of days since their last access
- Message students who are falling behind and encourage them to increase their course activity
- Congratulate students performing well in your course and ask them to be mentors
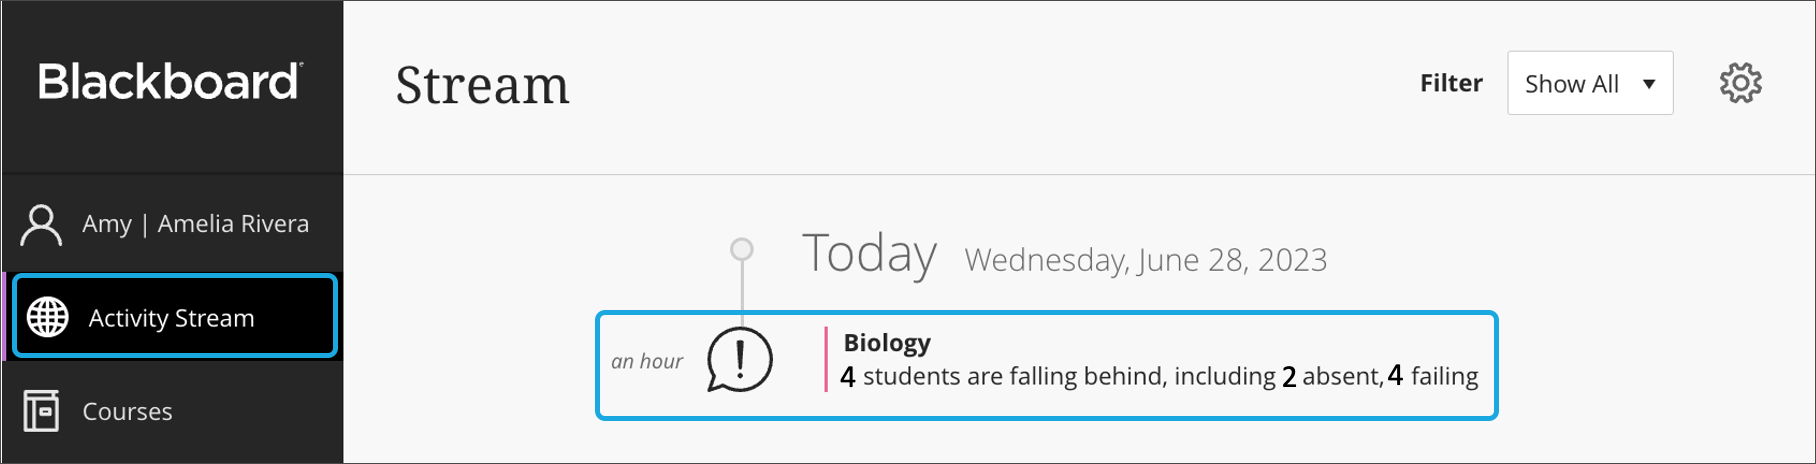
- Place an alert in the student's Activity Stream on the Bb homepage when their overall grade drops below a specific value or the student hasn't accessed the course for a certain number of days
- Notify students based on course alerts when the days since their last access or their grade in the course is below expected
- Download the table view to a CSV (comma-separated values) file to analyze the data with other tools
- Download the scatter plot as a PDF or image to share information with other instructors or mentors of the course
See:
Table View
Scatter Plot
Accessing the Course Activity Report
Select Course Activity in the course's Analytics tab.
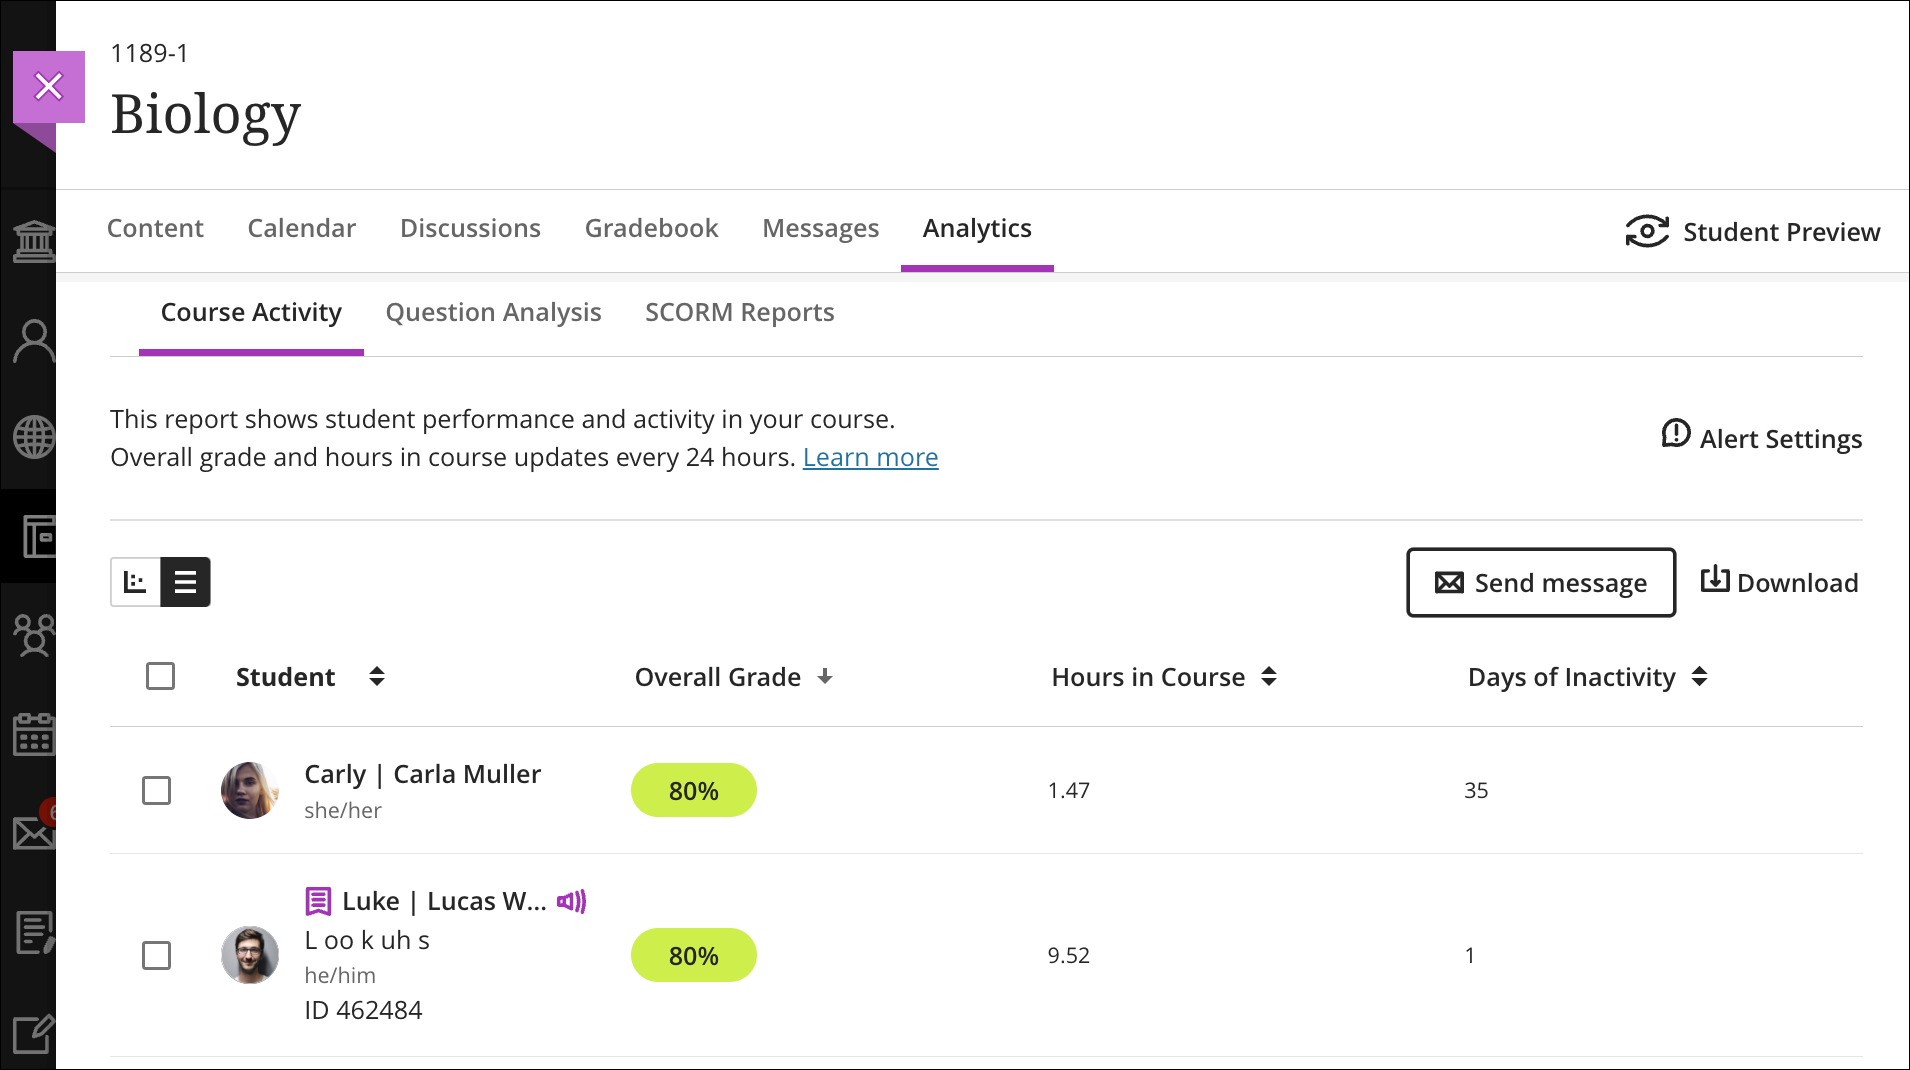
After students have interacted with the course and the report has data to display, you can use the table view.

You might see the table differently depending on settings, student activity in the course, and the data gathered in the course. The table has five columns:
- Student: Student's first and last name. Additional student information is shown if available: accommodations, additional name, name pronunciation recording, pronunciation description, pronouns, and Student ID.
- Overall Grade: A student's overall grade in the course. If the overall grade column is not turned on or if there is no graded material, this column won't display information. This column is updated every 24 hours, so the overall grade in the report might not match what is currently in the Gradebook.
- Missed Due Dates: Displays missed deadlines for any assessment, journal, discussion, SCORM package, and 3rd party activity (i.e., Respondus).
- Hours in Course: Number of hours a student has been active in your course. This column is updated every 24 hours. Hours in course are counted from the time students select something within the course to when students select something outside the course. If a student is logged out from their course session, only the time before their last action within the course is counted.
- Days Since Last Access: Counts the days since a student last accessed a course. Each time a student accesses the course, the count of days of inactivity changes to 0.
When there are no students enrolled in the course or for courses with more than 1000 students, no data displays.
A flag appears for students with alerts in the Course Activity Report. Instructors can customize their course alerts based on these Performance Thresholds set in the course:
- A student’s overall grade in the course is below a specified percentage.
- The number of missed due dated is above or equal to a specified number.
- Number of days a student is inactive in the course (NOTE: 5 is the default value for number of days inactive in the course)
Click on Alert Settings in the upper right corner to open a side panel menu where Performance Thresholds can be set. To learn more see the Performance Thresholds tutorial.

When a student has met one of the Performance Thresholds set, a flag icon appears to the right of the grade pill in the Overall Grade column (student's grade has fallen below the specified percentage) or the right of the Days Since Last Access column (student has been inactive in the course for more than the days specified) The instructor may hover over a flag to view the alert type.

Using the Filter Alerts box, instructors can filter alerts for:
- All students
- Students with alerts
- Students without alerts
Table Options
- You can choose students and send them messages by selecting the Send message icon. When you send a message to multiple students, each student will receive an individual message and will not know which other students were included.
- Select the Download button to download the table as a CSV. The exported file contains the following columns:
- Last Name
- First Name
- Username
- Student ID
- Overall Grade
- Hours in Course
- Days of Inactivity
- Last Access Date
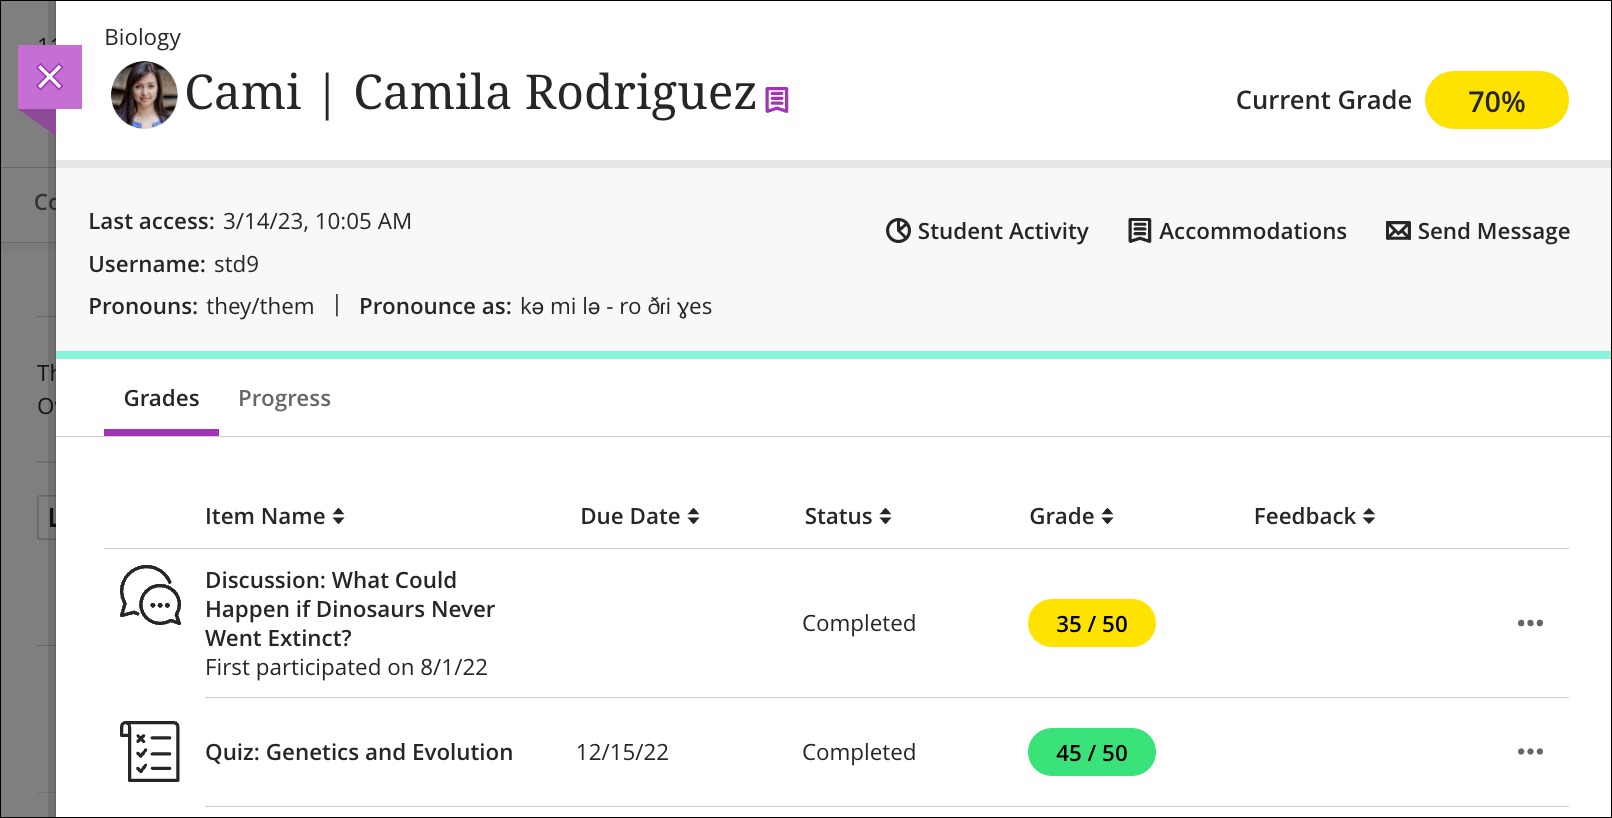
- Select a student on the table to bring up the Student Overview Page to check the student’s additional information, grades, progress, and more.
The scatter plot's Y-Axis represents the students' overall grades and the X-Axis represents the students' number of hours in the course. You have a broad view of student performance in relation to each other and their activity levels. The data shown is refreshed every 24 hours.
Note: The scatter plot is not compatible with screen readers. When there are no students enrolled in the course, if the Overall Grade feature is not turned on, or for courses with more than 1000 students, the scatter plot is not available.
You can identify students with alerts in the Scatter Plot view of the Course Activity Report. In the chart, purple dots indicate students with at least one (1) alert. You can select the dot to display student information. An alerts section explains the applicable alerts for the student.
- As before, activity stream notifications summarize students with alerts per course. Instructors may select these notifications to open the Course Activity Report. When accessing the report via notifications, the filter “Students with alerts” is auto-applied.

Each dot represents a student. Students who spend more hours in the course tend to have higher grades. You can:
- Zoom in or out by selecting the + and – icons at the top right. To focus on a specific region, select somewhere on the chart and drag to zoom in.
- Identify visually odd trends, such as students with low grades who are spending a lot of time in the course or high-performing students.
- Select a dot to display the student's name, overall grade, hours in course, and days of inactivity. Hours in course are counted from the time students select something within the course to when students select something outside the course. If a student is logged out from their course session, only the time before their last action within the course is counted.
- Select View Details to bring up the student's activity details report to check the student's progress on a weekly basis. You can visit the Student Activity Details topic for more information.
- Select the Download button to download the scatter plot as a PDF or image file. The scatter plot can be shared with other instructors, academic staff, or mentors of the class. Clicking the Download option places the data in a CSV file where the Low Overall Grade and Last Access alert columns indicate when a student has an alert.

Students with alerts, receive a notification in their Activity Stream on the Bb homepage: